Owli-AI Research
A Pattern Collection for Generating Accessible Teaching Materials for Blind and Visually Impaired Students in Computer Science and Electrical Engineering
(2025) - Paper
Diethelm Bienhaus; Michael Kreutzer
Technische Hochschule Mittelhessen University of Applied Sciences, Germany
Notice: this page was machine-translated and is pending editorial review.
Visual

Abstract
This paper addresses the problem that graphical representations such as circuit diagrams, Karnaugh maps, or UML diagrams are often inaccessible for blind and visually impaired students in STEM education. It shows that general guidelines such as WCAG do not provide sufficiently concrete workflows for subject-specific teaching materials. As a contribution, the authors present a collection of five pedagogical design patterns: transformable text-first authoring, textual modeling for diagram generation, tactile and haptic workflows, auditory preparation of time series, and human-in-the-loop explanations. The patterns are derived from teaching practice and are complemented by tool recommendations and implementation examples. The goal is a structured methodology for multimodal teaching materials usable with screen readers, braille displays, tactile printing, and sonification tools. Although developed in computer science and electrical engineering education, the paper describes transferability to other diagram-centered disciplines.
Keywords
- accessibility
- blind and visually impaired (BVI)
- accessible teaching materials
- STEM education
- assistive technologies
- artificial intelligence
Download
Figures
10 visuals from the paper.
-
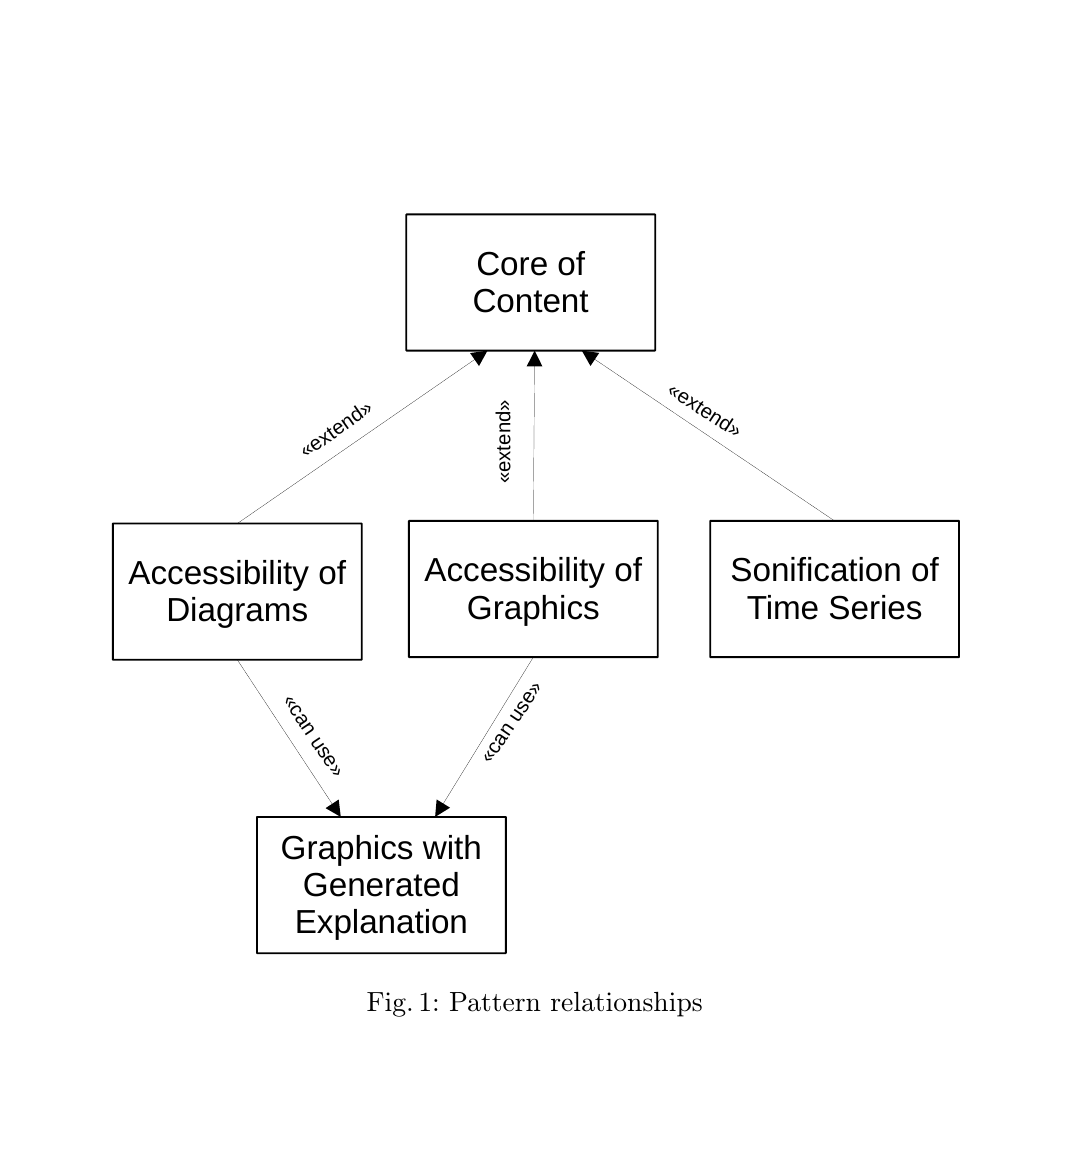
Fig. 1 Pattern relationships in the collection. -
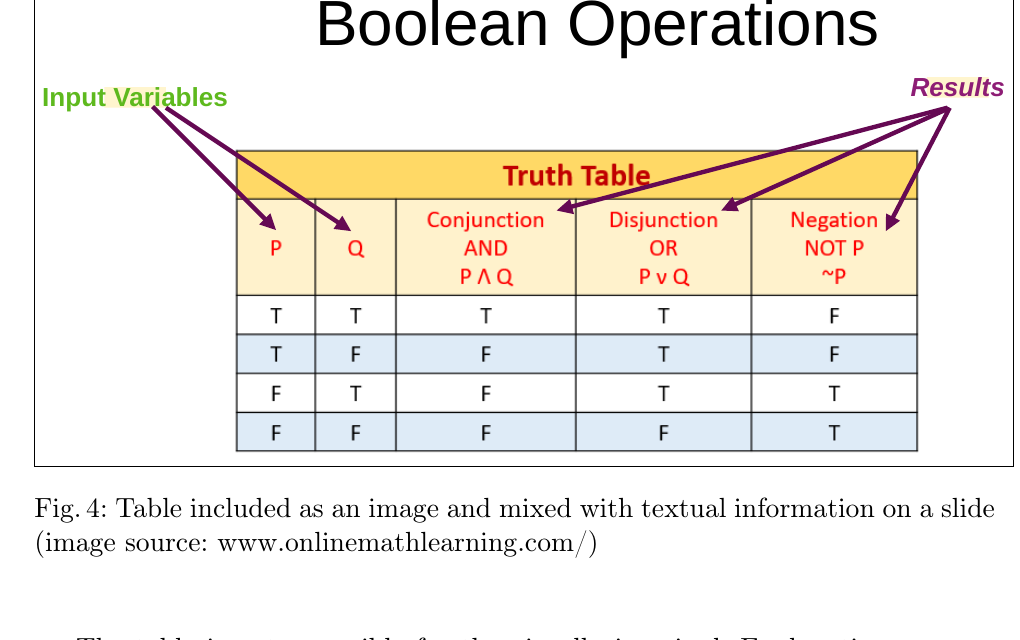
Fig. 4 Table as image inside a lecture slide. -
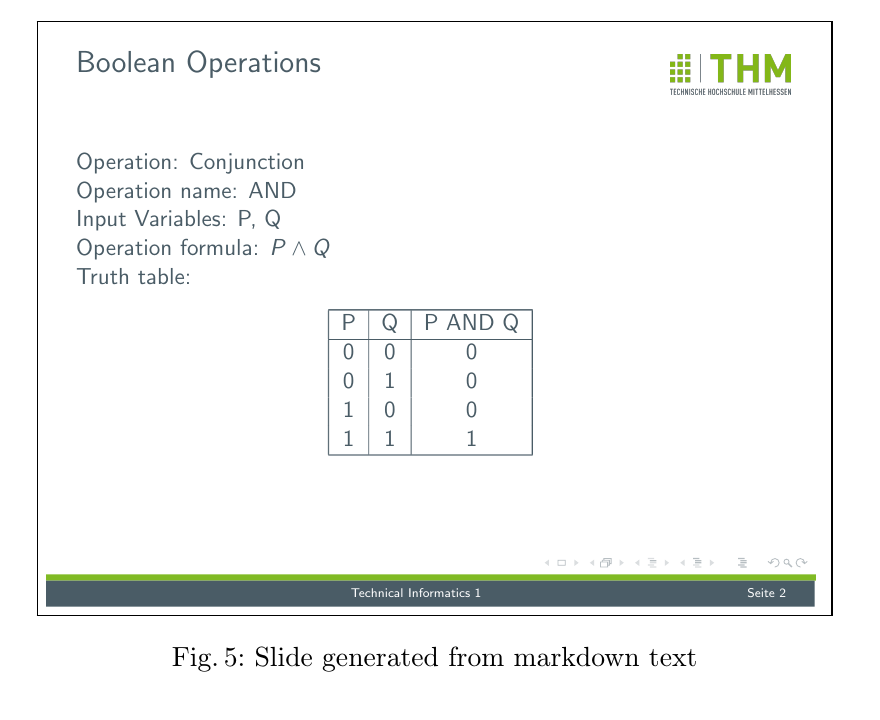
Fig. 5 Slide generated from Markdown. -
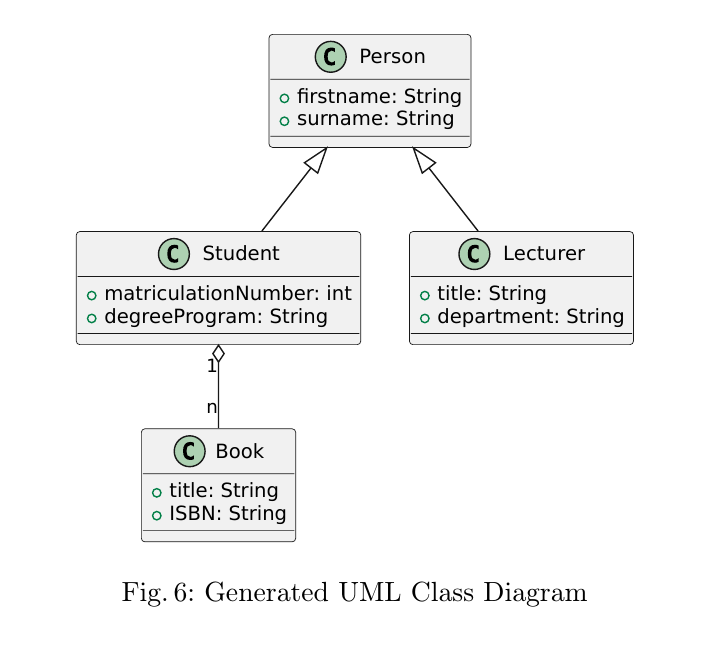
Fig. 6 Generated UML class diagram. -
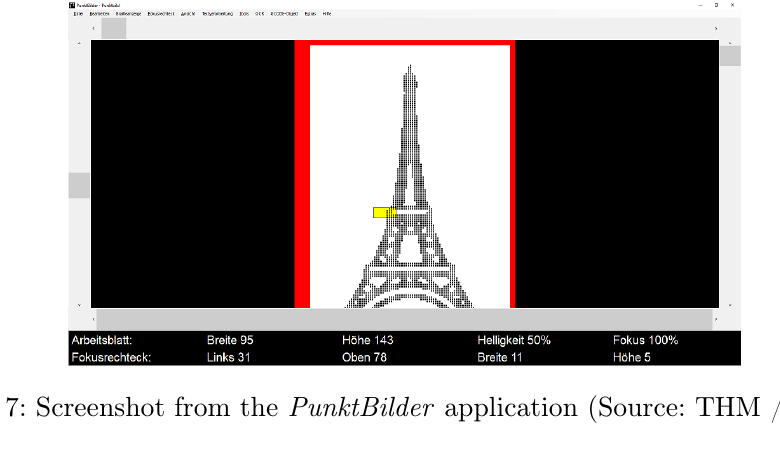
Fig. 7 Screenshot of the PunktBilder application. -
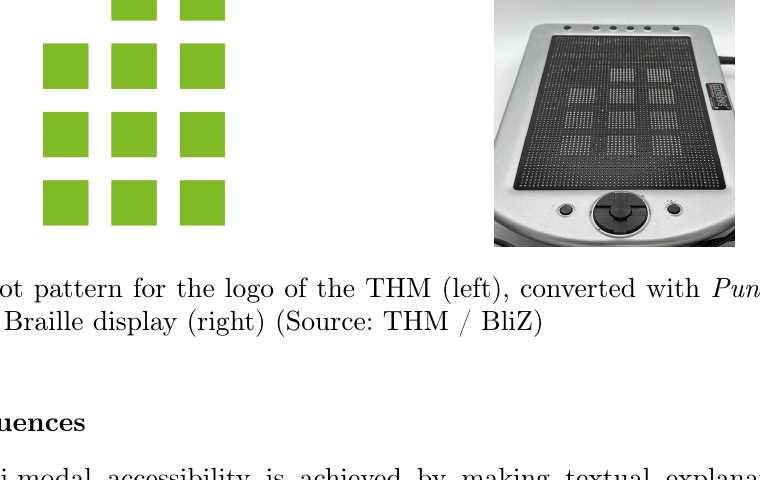
Fig. 8 Dot pattern and output on a 2D braille display. -
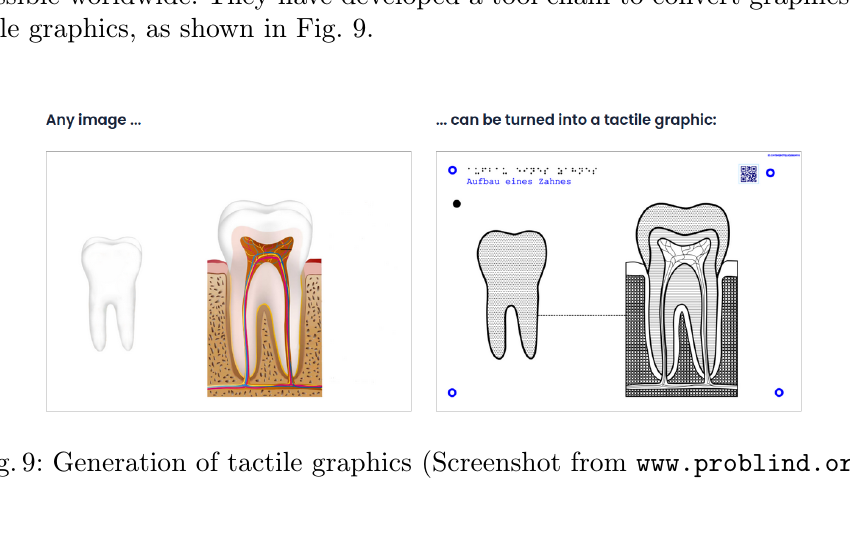
Fig. 9 Tactile graphics generation. -
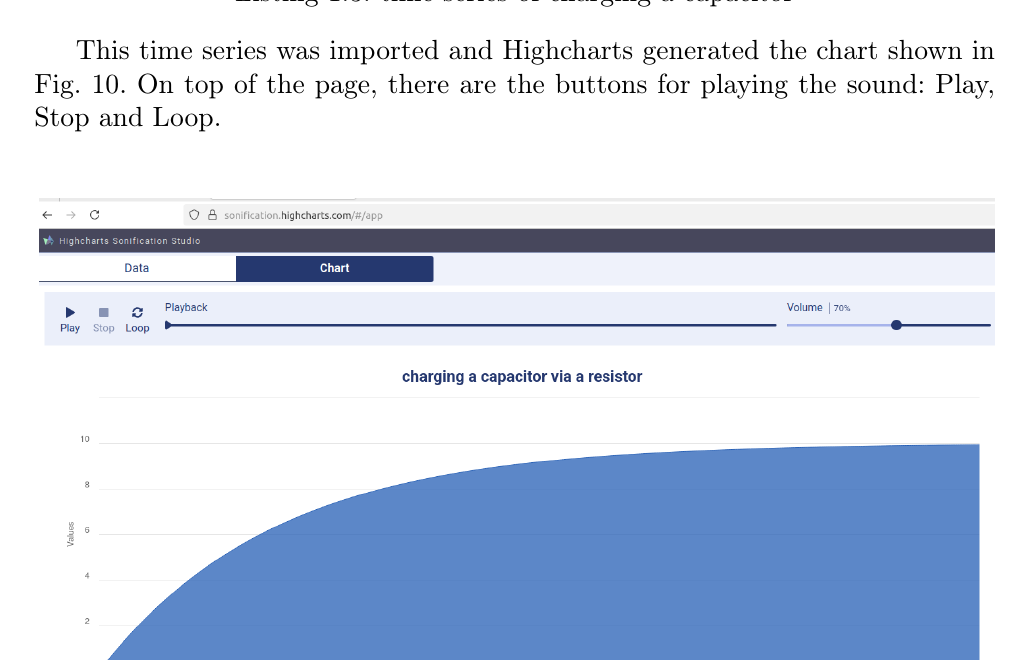
Fig. 10 Screenshot of a sonification website. -
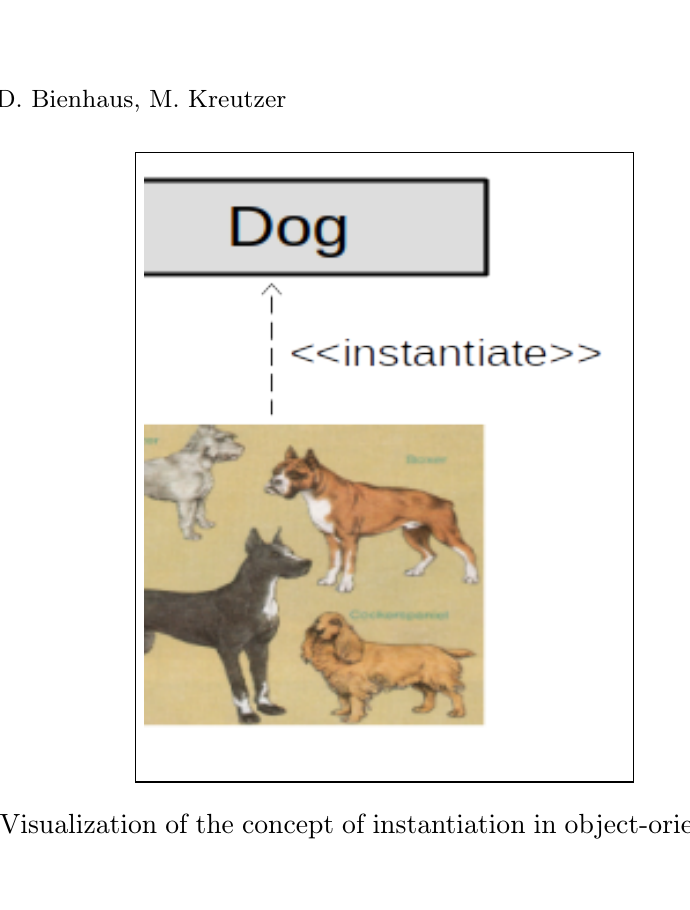
Fig. 11 Visualization of instantiation concept. -
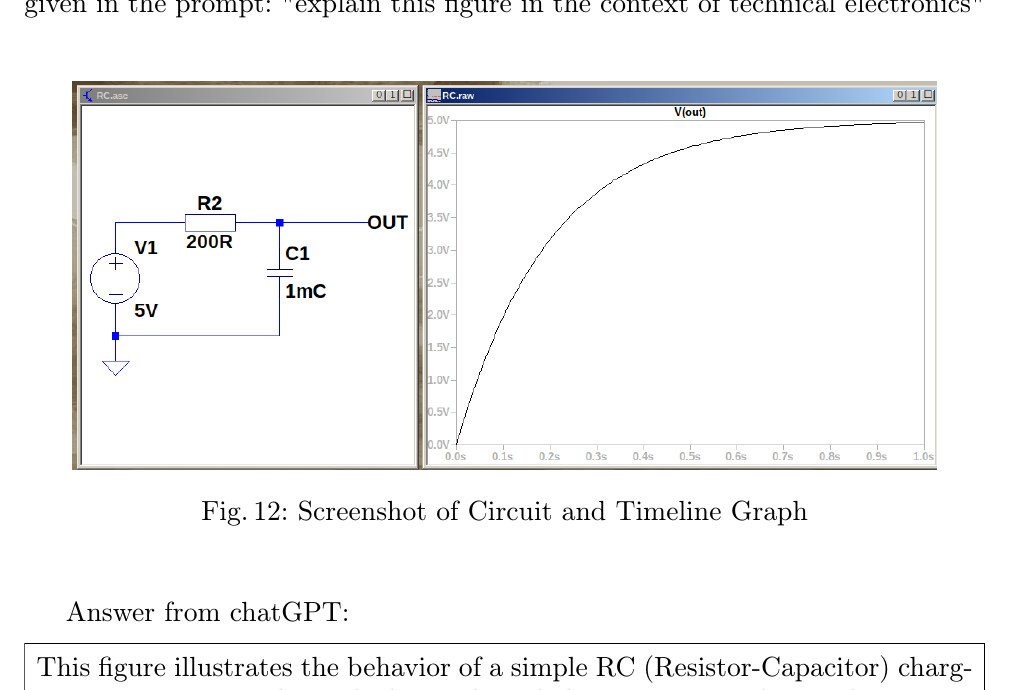
Fig. 12 Screenshot of circuit and timeline graph.


